GET YOUR INSPIRATION
Explore the content we’ve prepared to help you discover and get to know the endless possibilities in ADOIT.
Our sample content will give you an introduction into what you can do, as well as where ADOIT can support you.
You can access all sample content through your ADOIT model catalogue.
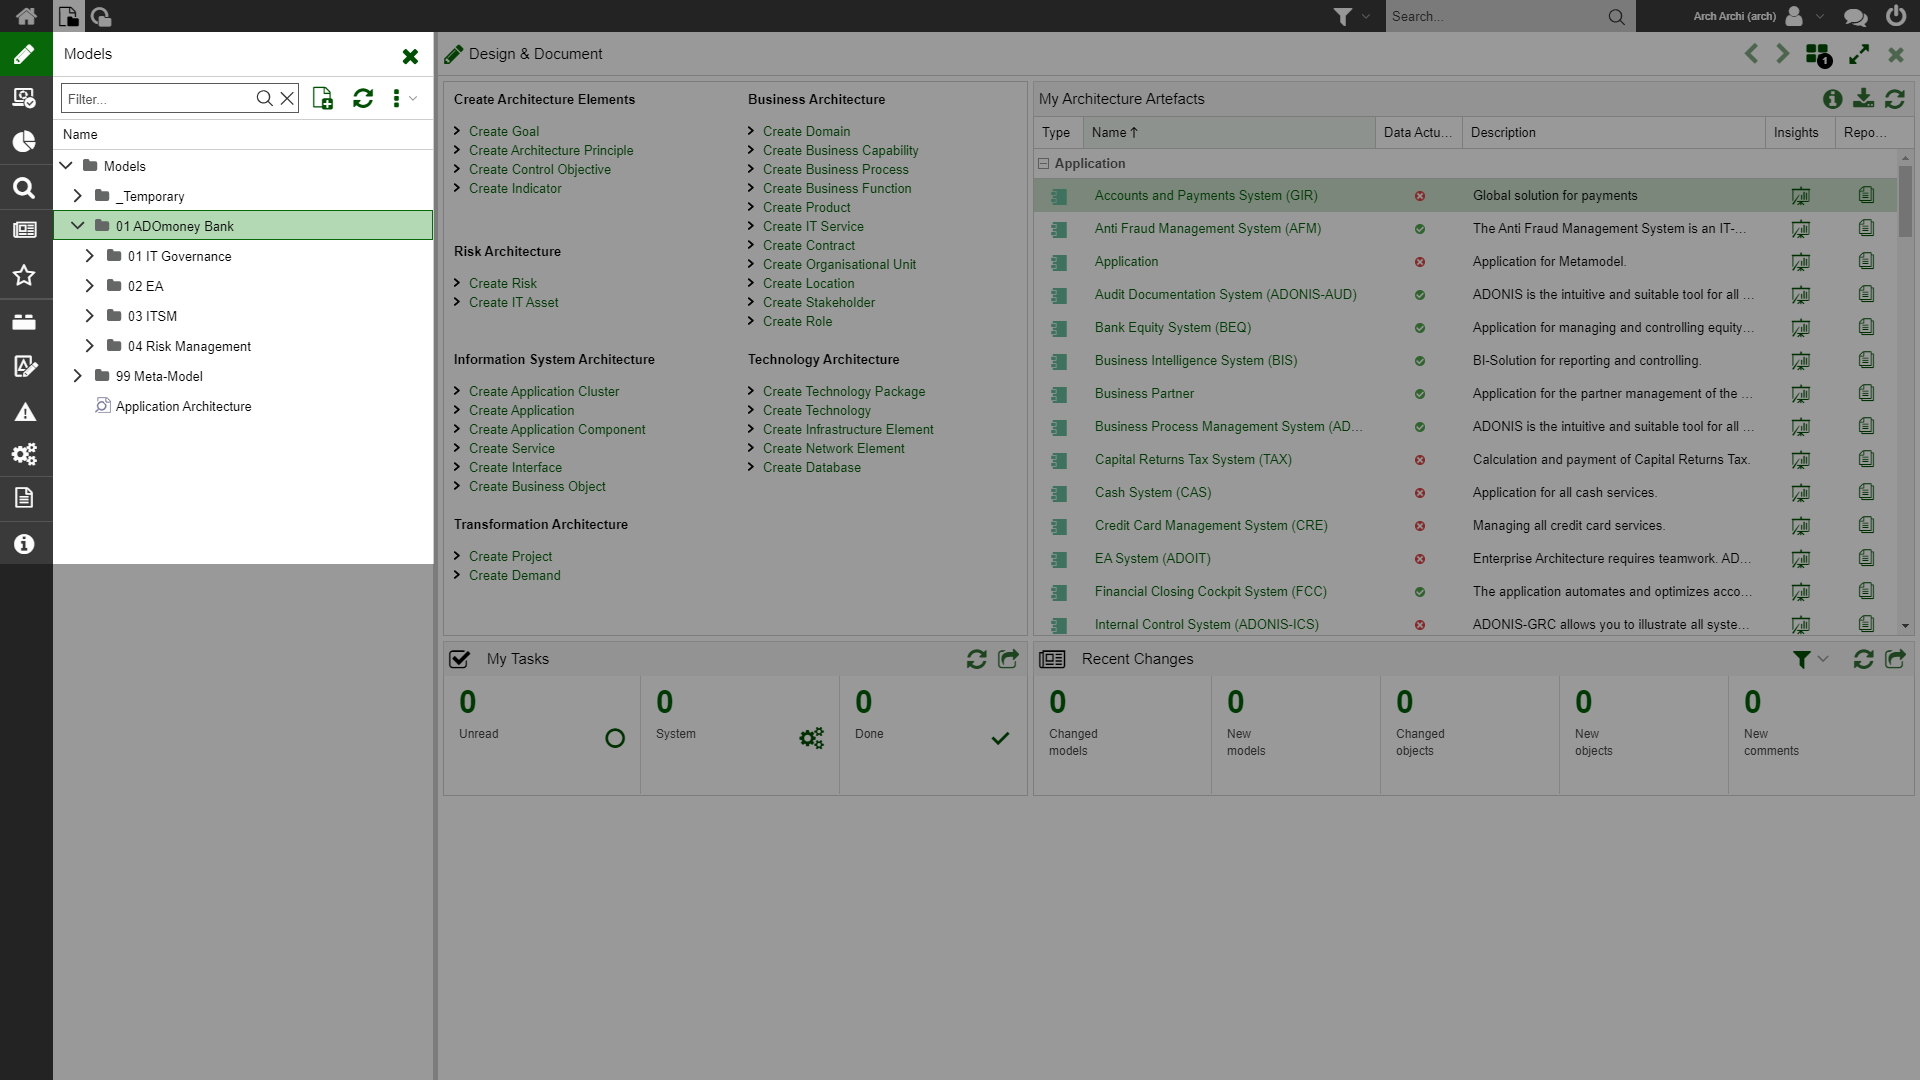
1. Open the model catalogue
in the top left corner.
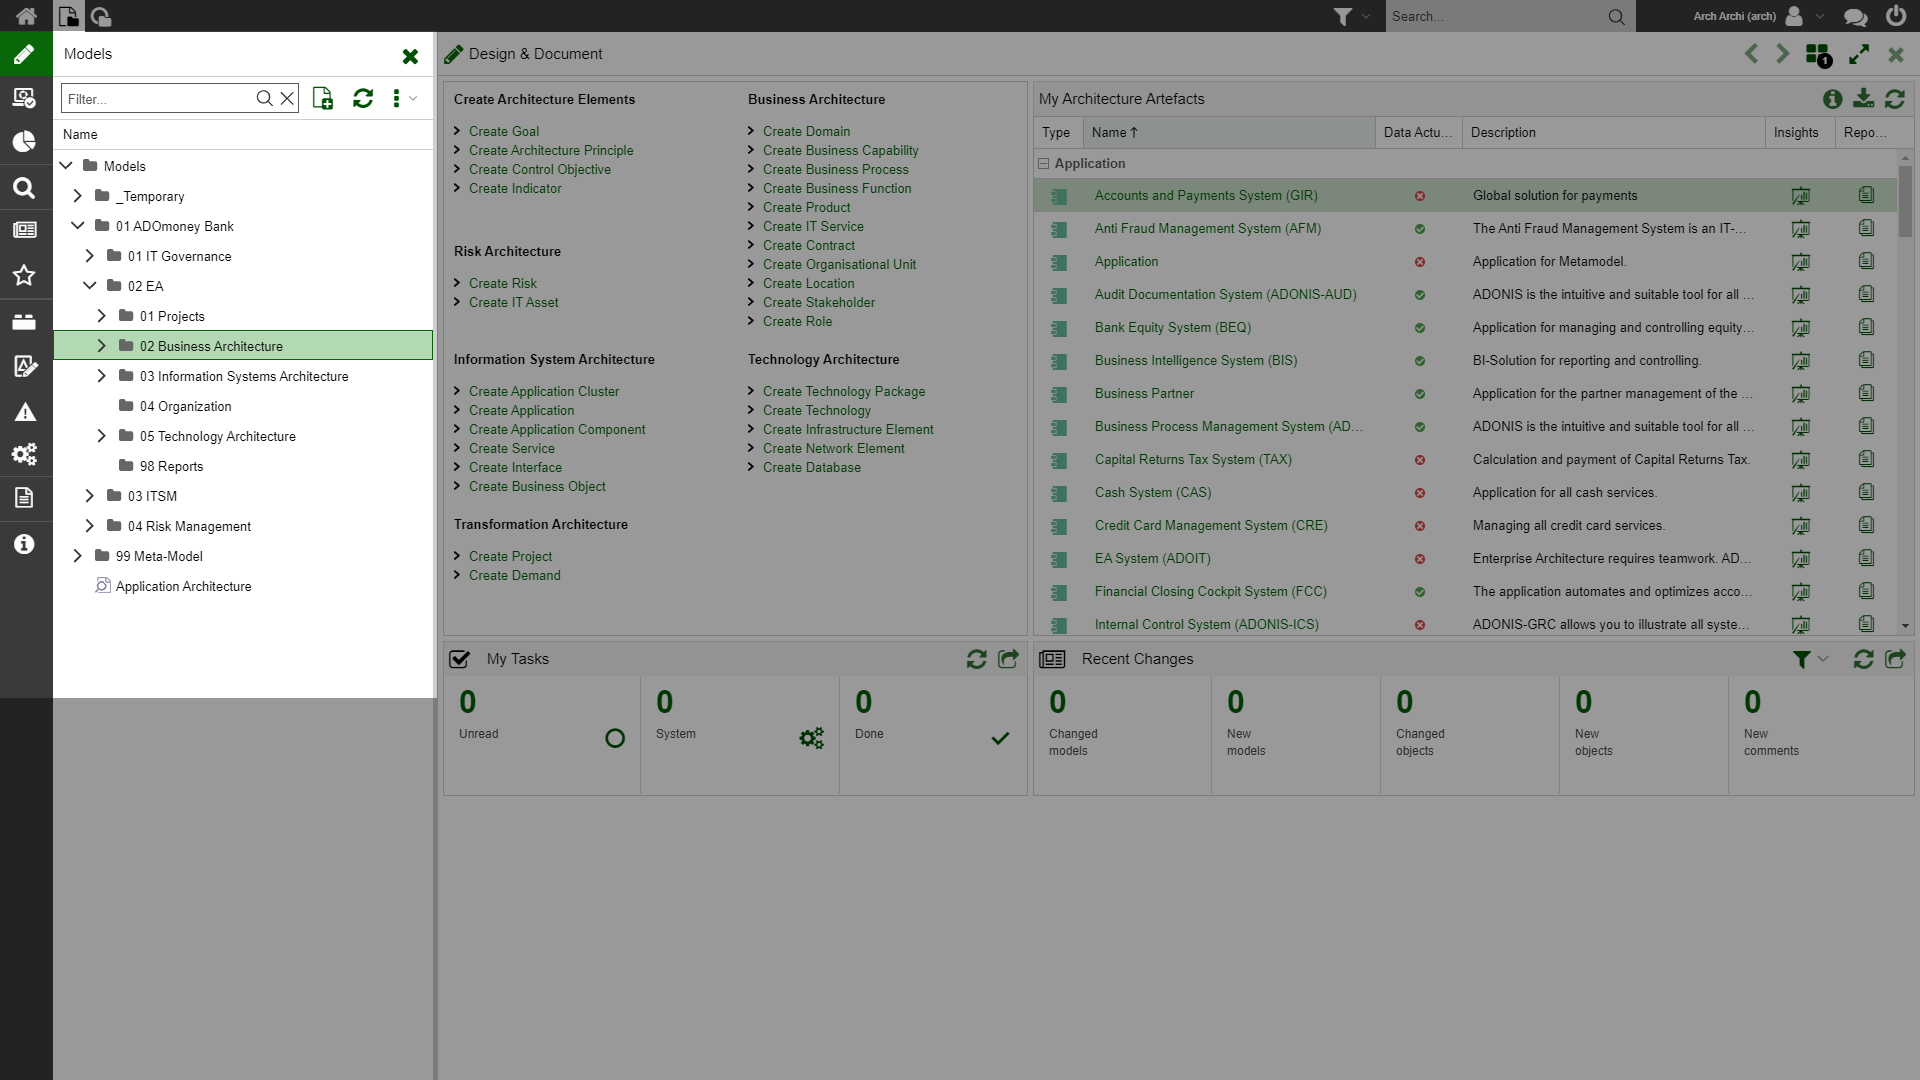
2. Open the ADOmoney Bank subfolder
with the name “02 Business Architecture”.
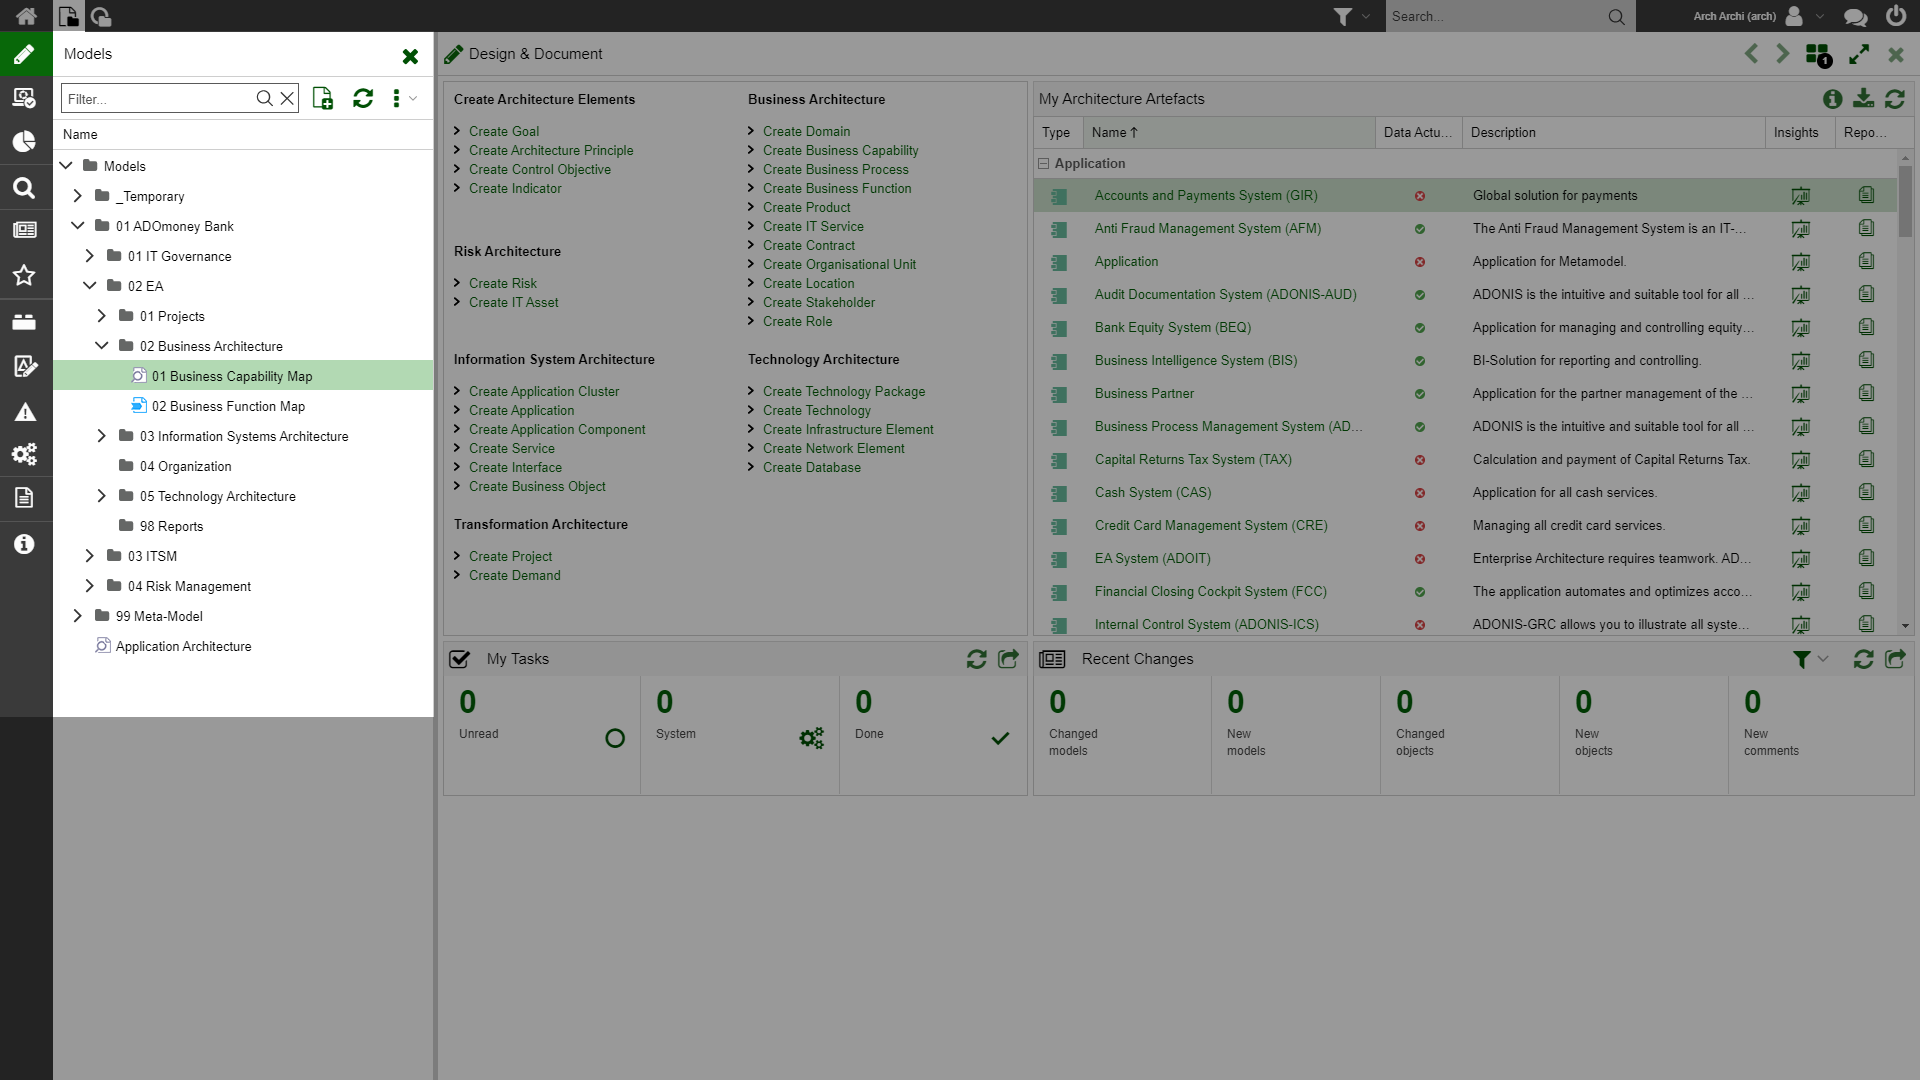
3. Open the “Business Capability Map”
at the top of the directory.
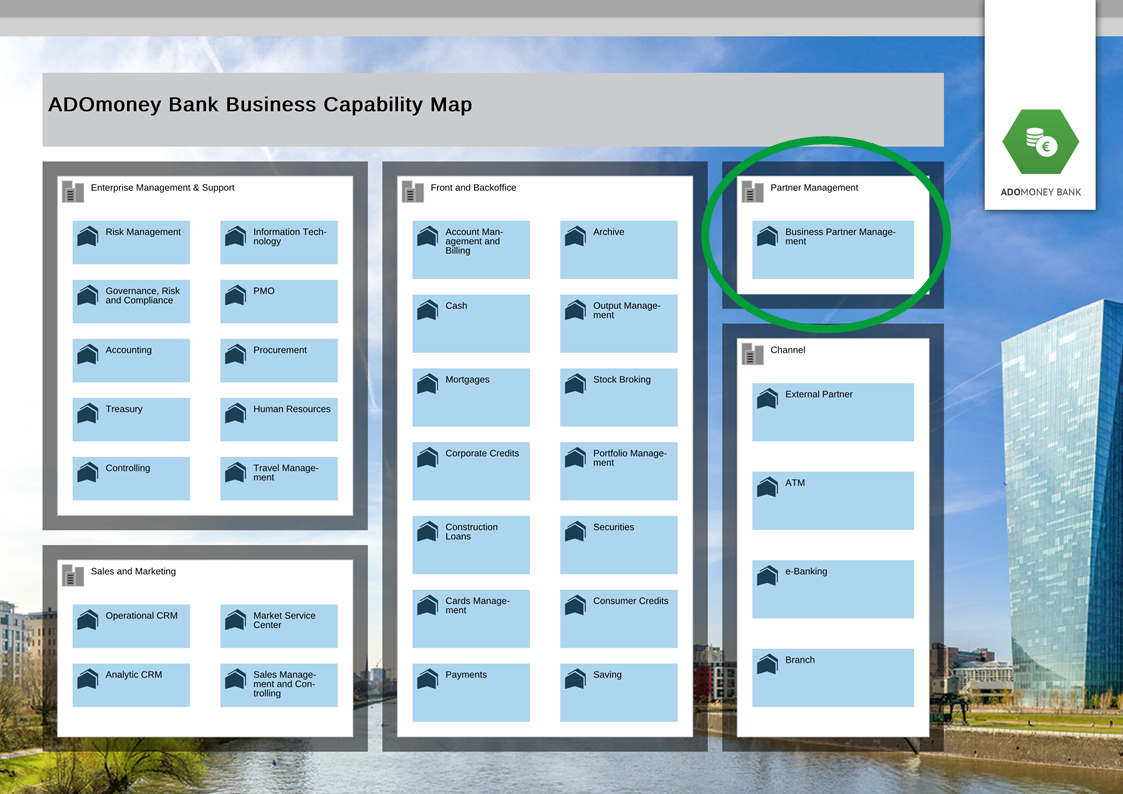
THE ADOMONEY BANK BUSINESS CAPABILITY MAP
The business capability map provides an overview of all ADOmoney Bank’s business capabilities, from enterprise management and support, to channel capabilities. This time, the focus lies on the “Business Partner Management” capability and the analysis of its IT fitness.
Step 1: Open the model catalogue. Step 2: Expand the group (folder) “01 ADOmoney Bank”, as well as the groups “02 EA” and “02 Business Architecture”.
Step 3: Double-click the model “01 Business Capability Map”.
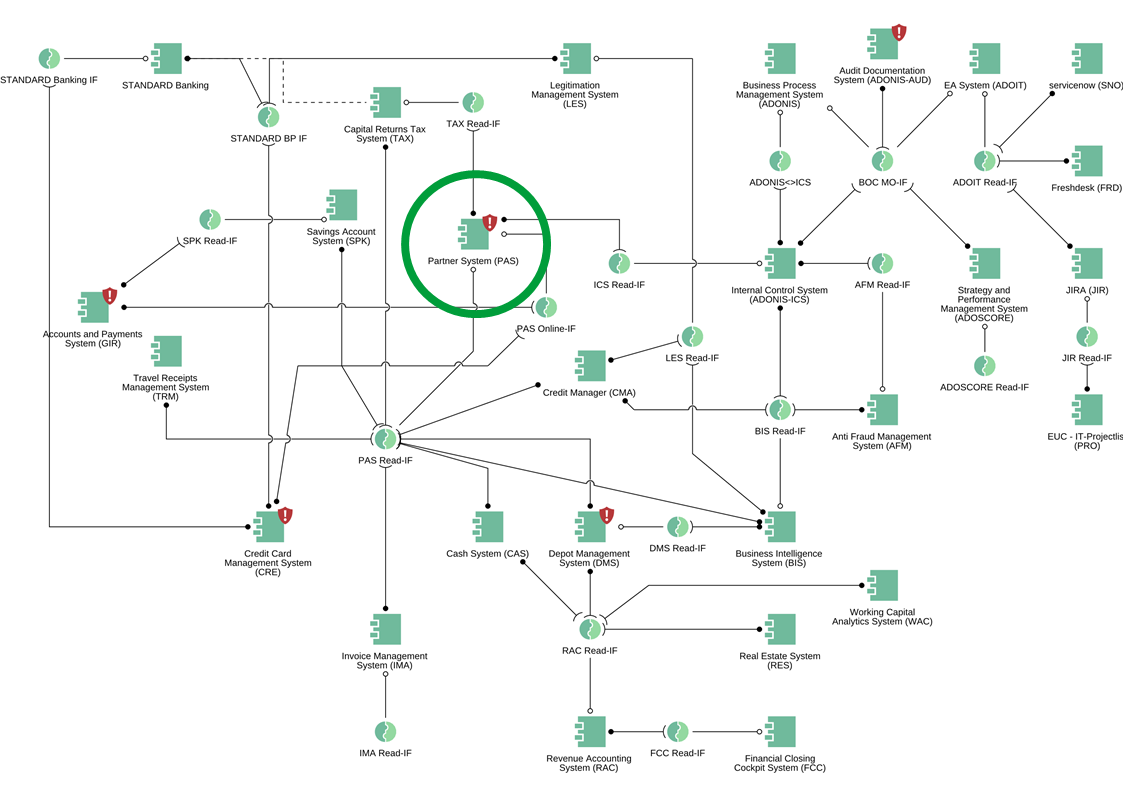
ALL DETAILS IN THE APPLICATION LANDSCAPE
Drilling down further, the application landscape provides an overview of selected applications assigned to the „Business Process Management“ capability. What’s more, the accompanying information, such as the provided and used interfaces of surrounding applications, also contribute to the detailed view of the capability at hand.
Step 1: Open the model catalogue. Step 2: Expand the group (folder) “01 ADOmoney Bank”, as well as the groups “02 EA” and “03 Information Systems Architecture”. Step 3: Double-click the model “1a Application Architecture V1”.
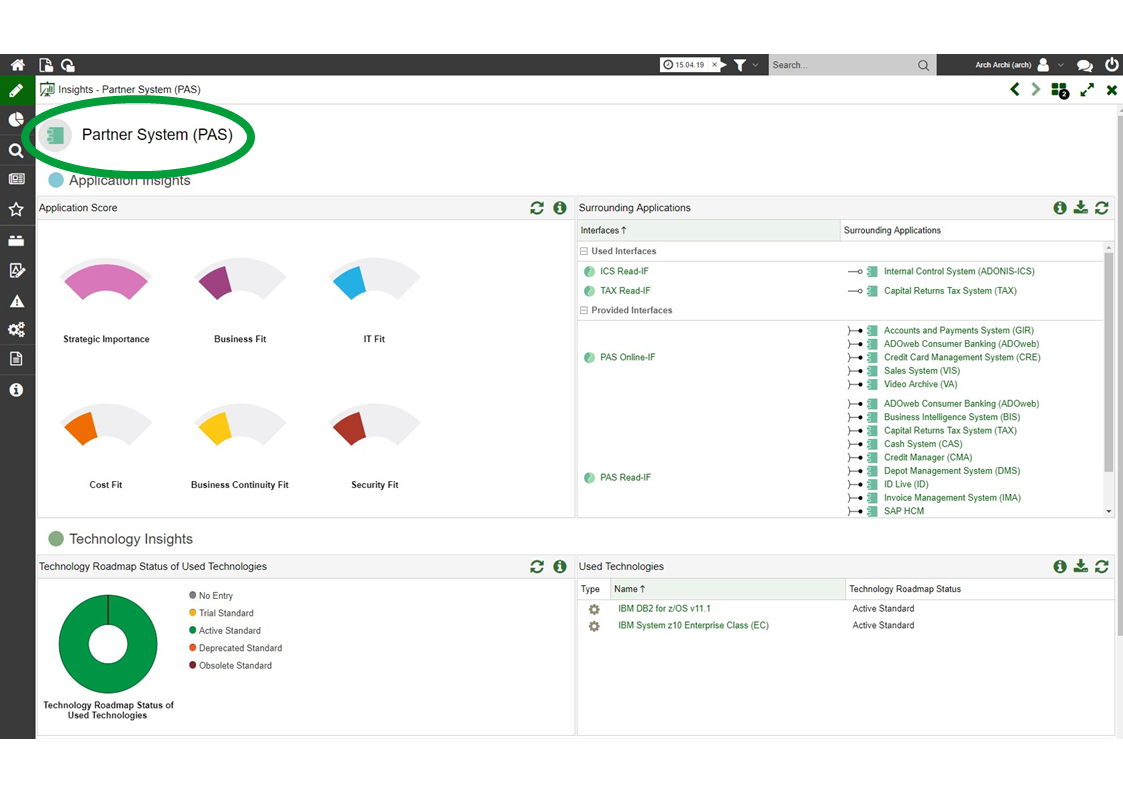
THE INSIGHTS DASHBOARD
The Insights Dashboard automatically gathers and visually portrays all key information about your objects. In this case, the dashboard displays extended information about the “Partner System (PAS)” application, or more precisely its application score, surrounding applications and used technologies.
Step 1: Open the object catalogue. Step 2: Search for the the initials “PAS”. Step 3: Double-click the “Partner System (PAS)” application. Step 4: Click on the insights icon in the top right corner to display this content in the Insights Dashboard.
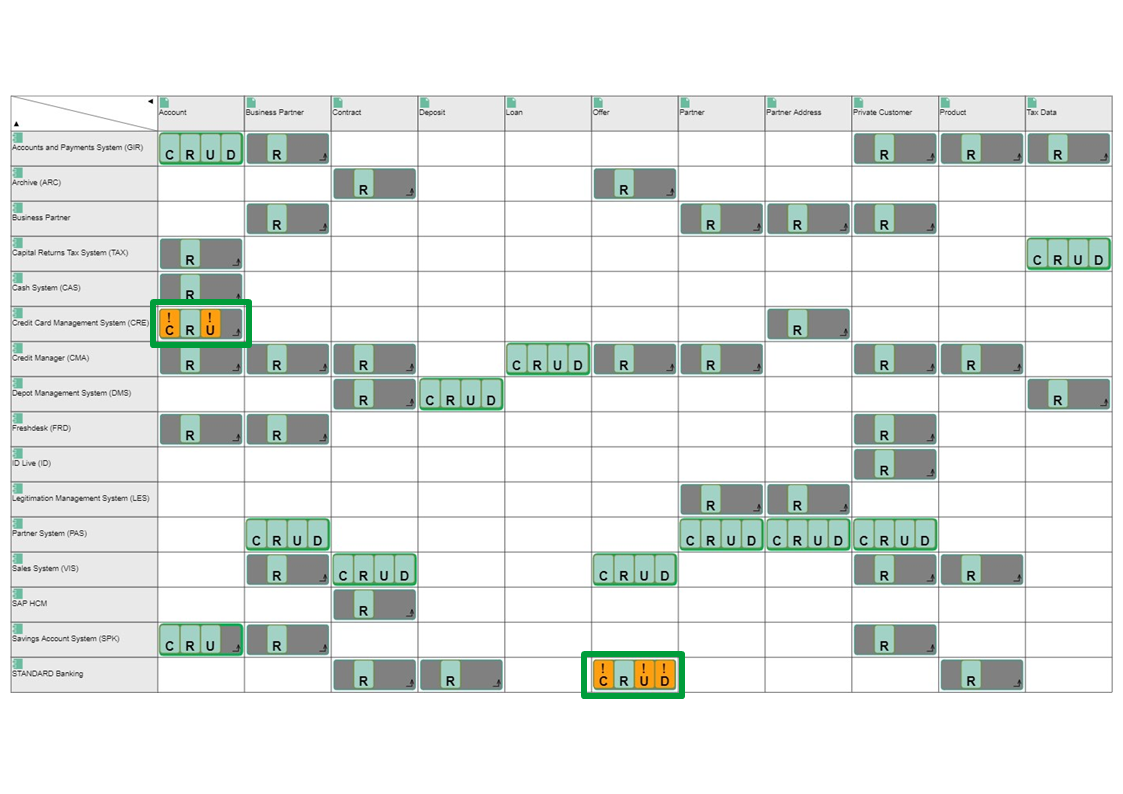
MASTER DATA MANAGEMENT
The Matrix shows your applications, the data objects they access, as well as data degree of manipulation using the “CRUD” method (create, read, update, delete). Based on this graph, we see there’s data redundancy within the organization, meaning that the existing applications manipulate the data in a form which they are not allowed to.
Step 1: Click on “Search” in the navigation menu on the left side of the screen. Step 2: Expand the “Search options and filters”. Step 3: Click the “Object” filter and select “Application”. Step 4: Mark the displayed results. Step 5: Right-click the marked objects and select “Create view“ from the context menu. Step 6: Choose “Matrix…” and then “Business Object x Application [CRUD]”. Step 7: Click the icon “Change visualisation” on the upper right-hand corner of the screen and select “CRUD”.
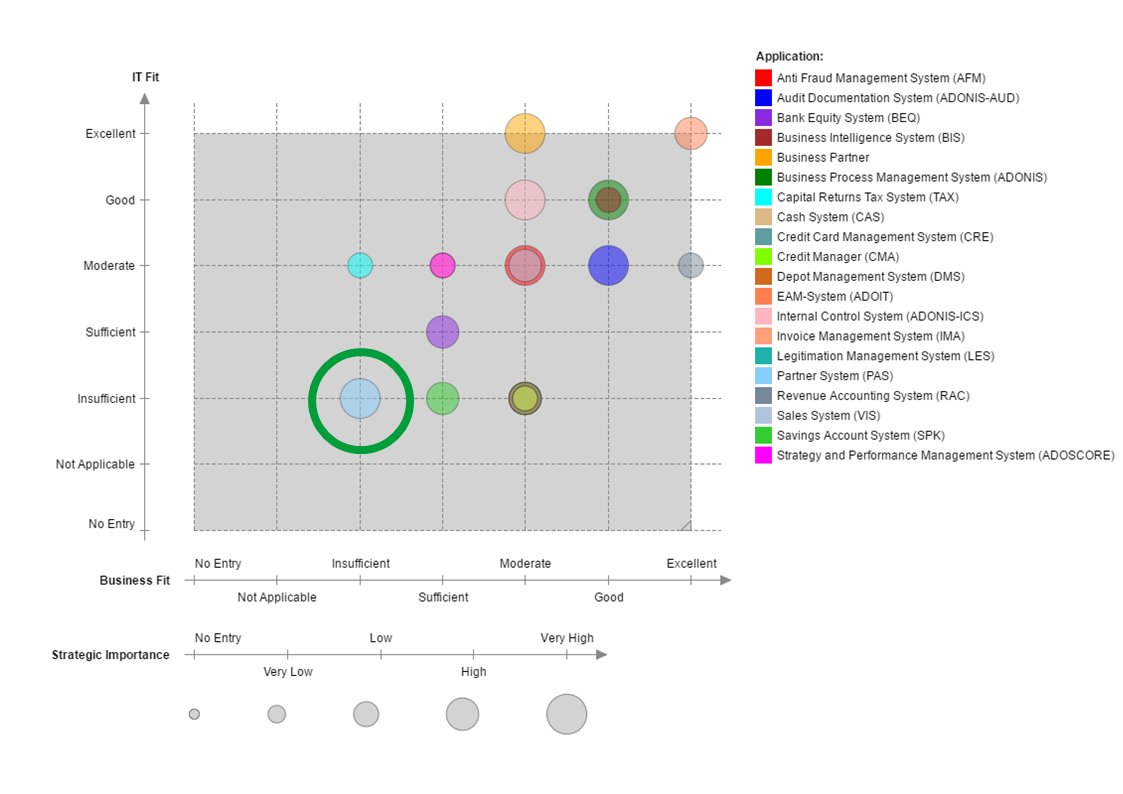
DETAILED LOOK AT THE APPLICATIONS PORTFOLIO
The portfolio view compares all your applications based on certain criteria. In this instance, the application portfolio is evaluated based on IT Fitness, Business Fitness and Strategic Importance. From this, we can see that the „Partner Systen (PAS)“ application is evaluated insufficiently, in terms of its IT and Business Fitness.
Step 1: Open the object catalogue. Step 2: Search for the initials “PAS”. Step 3: Right-click the application “Partner System (PAS)”. Step 4: Select “Create view“ at the bottom of the context menu. Step 5: Select “Portfolio…” from the available options. Step 6: Choose “Business Fit – IT Fit – Strategic Importance”.
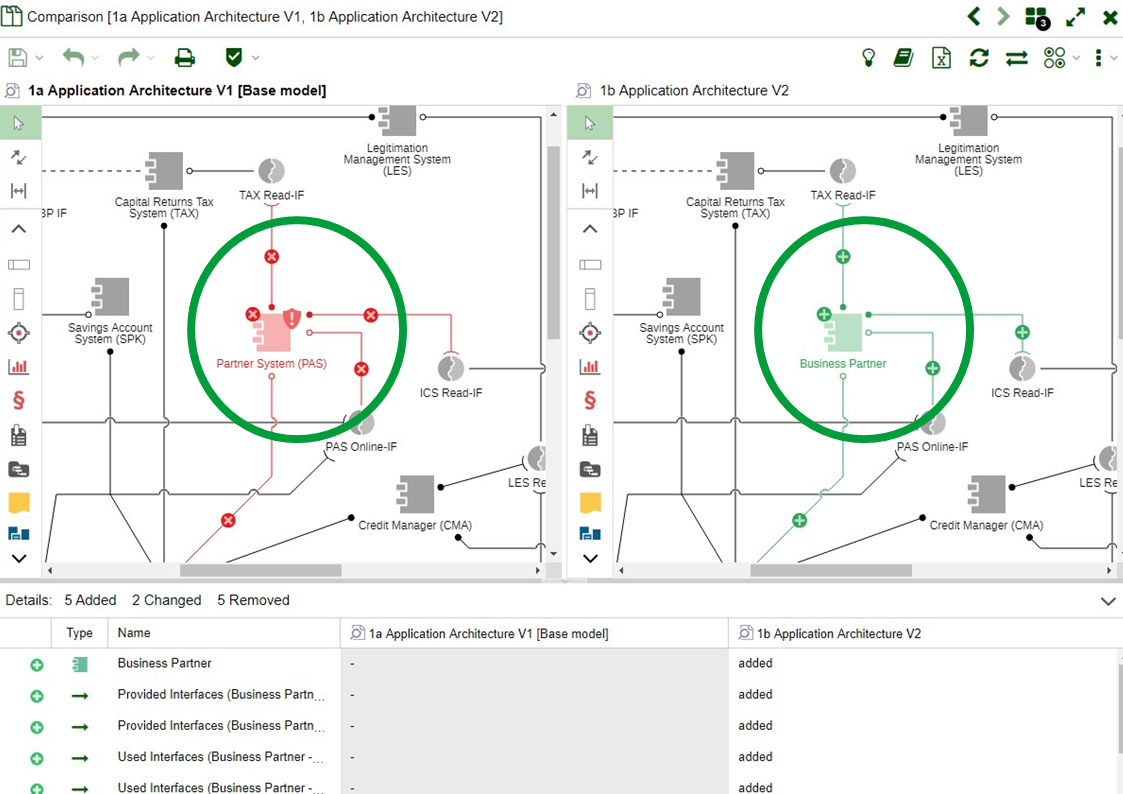
COMPARE YOUR AS-IS AND TO-BE ARCHITECTURES
Design your future architecture and visualize the differences between your AS-IS and TO-BE states with graphical and tabular model comparison. Here, we see a comparison between the current and the future architecture landscapes.
Step 1: Open the model catalogue. Step 2: Search for the model “1a Application Architecture V1” and the model “1b Application Architecture V2”. Step 3: Mark both models. Step 4: Right-click the marked models and choose “Compare” from the context menu.
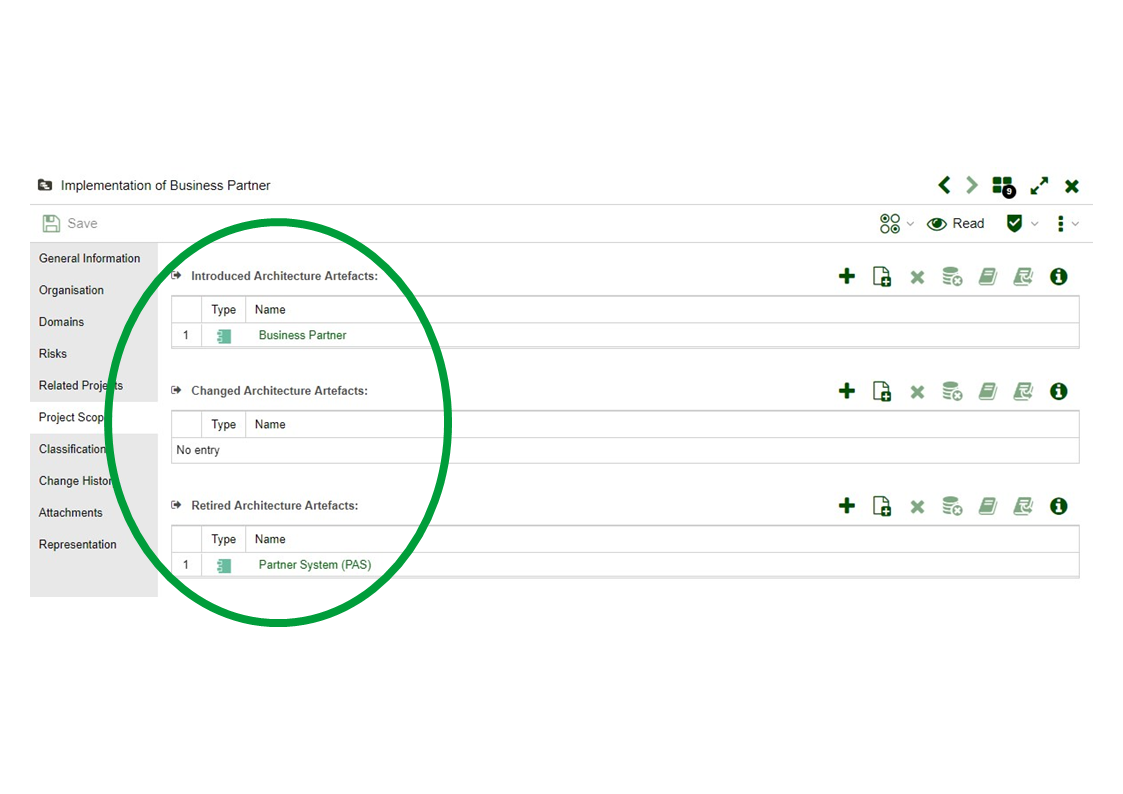
TRANSFORMATION PORTFOLIO MANAGEMENT
Analyse your AS-IS and TO-BE architectures and define specific projects for the development of your EA. Here, we can can see that the “Partner System (PAS)” application will get retired, and that “Business Partner” application is being introduced to the EA repository as its replacement.
Step 1: Open the object catalogue. Step 2: Search for the initials “PAS”. Step 3: Double-click the “Partner System (PAS)” application to open up the object properties. Step 4: Go into the “Projects” chapter and click on the referenced project “Implementation of Business Partner”. Step 5: Go into the “Project Scope” chapter of the object properties.
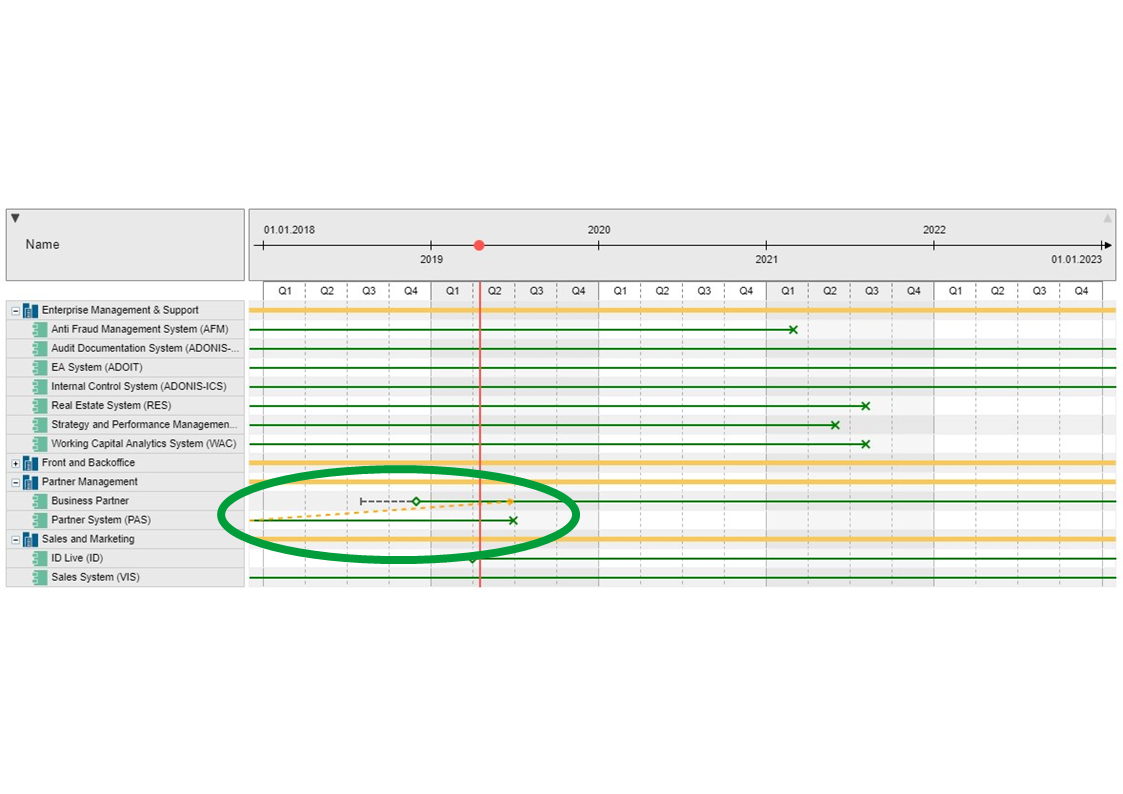
PLAN YOUR APPLICATION ROADMAP
The application roadmap provides a graphical overview of your applications’ life cycle. In this case, we can once again see that the “Partner System (PAS)” application will get replaced by “Business Partner” application.
Step 1: Open the object catalogue. Step 2: Search for “Partner Management”. Step 3: Right-click the “Partner Management” domain . Step 4: Select “Create view“ at the bottom of the context menu. Step 5: Select the “Gantt”view. Step 6: Select “Application Roadmap (Domains – Applications)”.
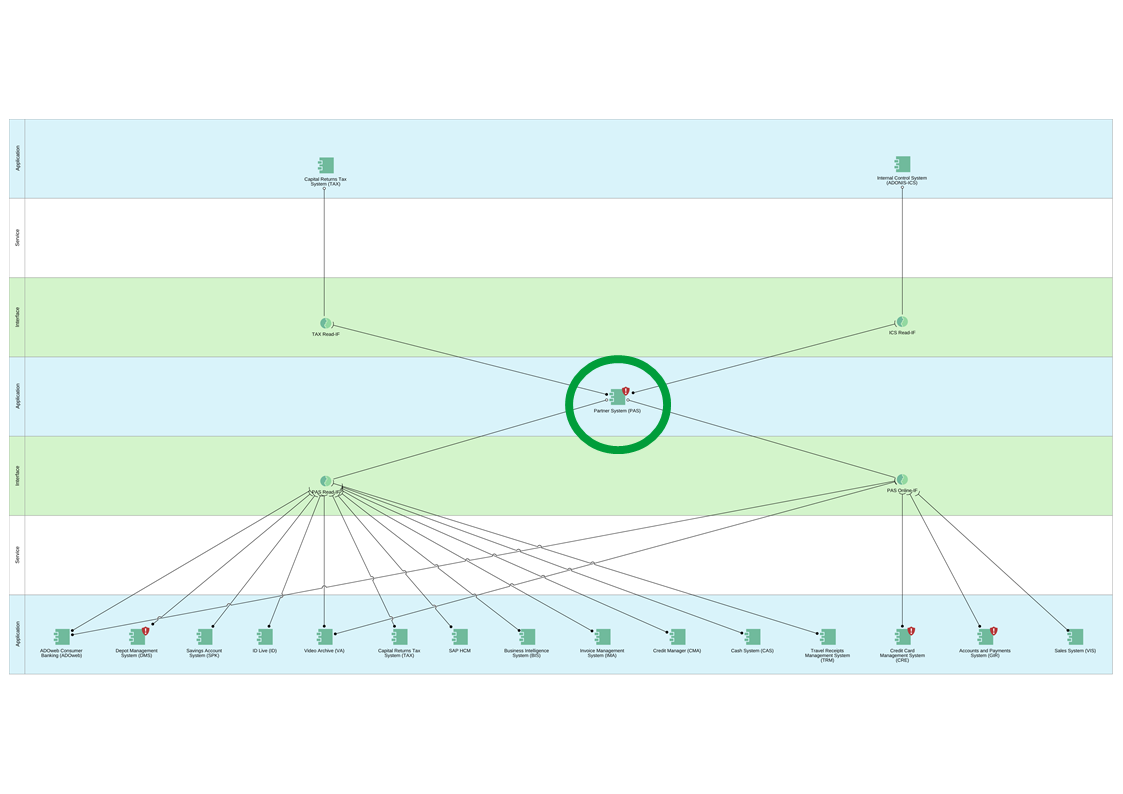
ANALYSE YOUR SURROUNDING APPLICATIONS
The interface report provides an overview of all applications using the provided interfaces, and therefore accessing the data from your system. For example, we can see that the “Partner System (PAS)” application provides two interfaces, which are in turn being accessed by several other applications.
Step 1: Open the object catalogue. Step 2: Search for the initials “PAS”. Step 3: Right click the “Partner System (PAS)” application. Step 4: Select “Reports“ from the context menu. Step 5: From there, select the “Interface Report”.
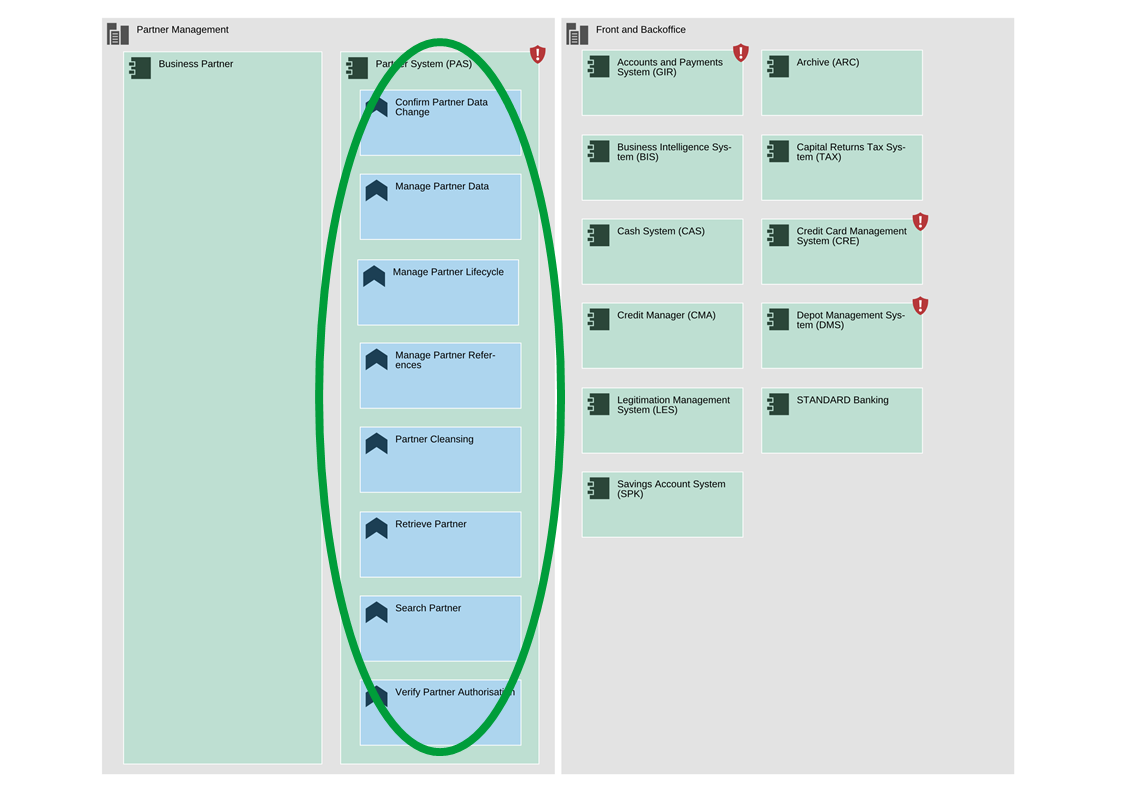
BUSINESS-IT ALIGNMENT
The cluster map gives an overview of all applications and their supported business functions. When planning changes to your application portfolio, it’s important to ensure that existing business functions are also supported in the future.
Step 1: Open the model catalogue. Step 2: Expand the group (folder) “01 ADOmoney Bank”, as well as the groups “02 EA” and “03 Information Systems Architecture”. Step 3: Double-click the “Clustermap: Domain > Application > Business Function” model.
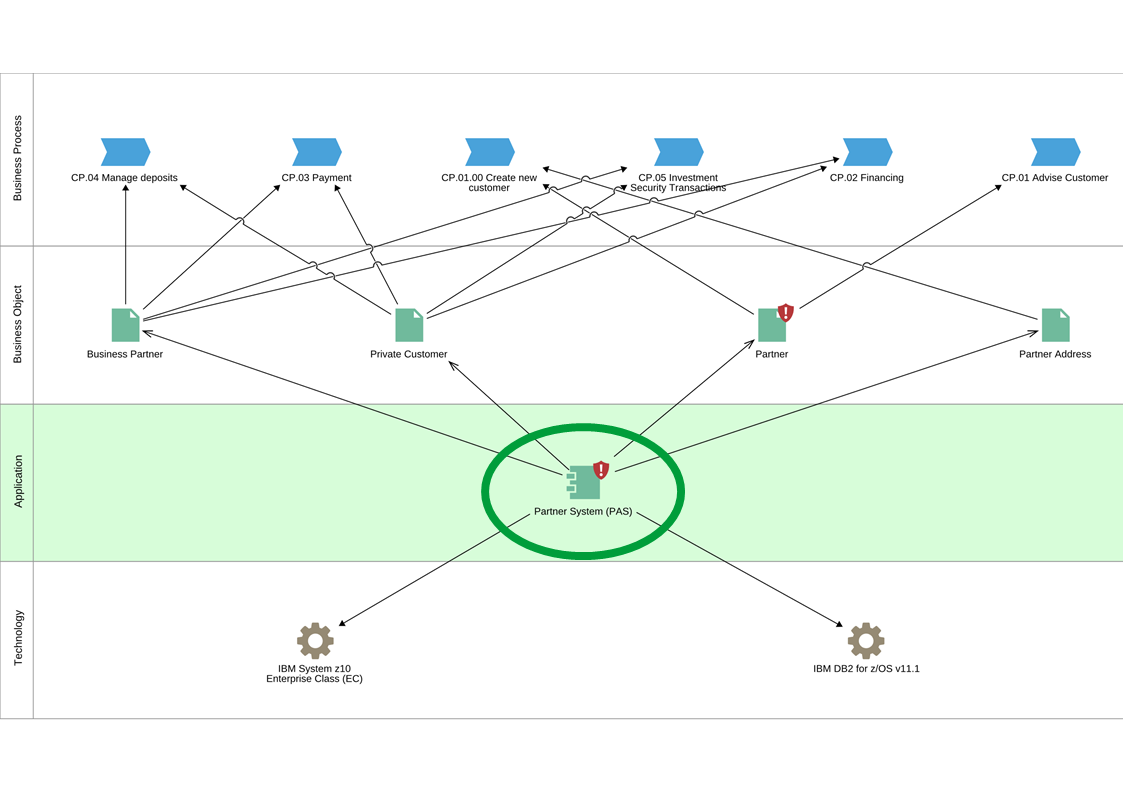
THE BUSINESS IMPACT ANALYSIS VIEW
A Business Impact analysis shows the influence of an object across the different architecture layers. With this view, we can analyse the impact of replacing the “Partner System (PAS)” application in our Enterprise Architecture.
Step 1: Open the object catalogue. Step 2: Search for the initials “PAS”. Step 3: Right click the “Partner System (PAS)” application. Step 4: Select “Create view“ at the bottom of the context menu. Step 5: Choose the “BIA” view. Step 6: Select “Application Impact: Business Process – Business Object – Application – Technology”.
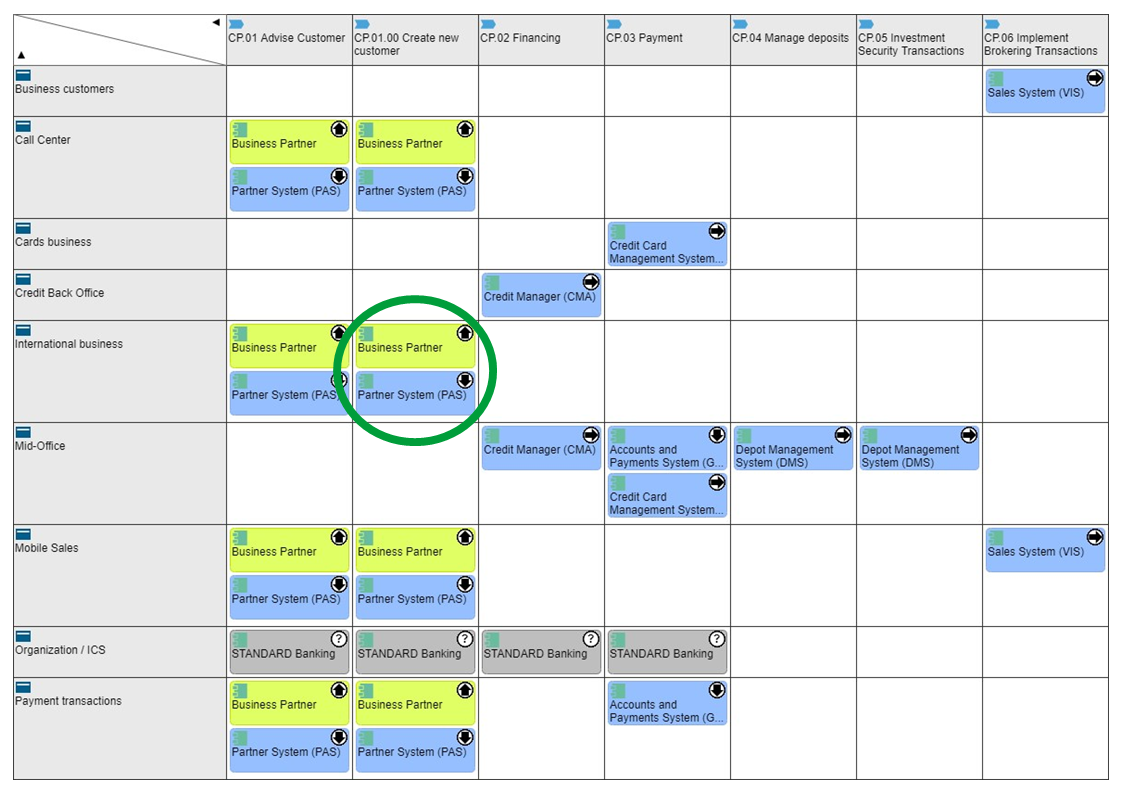
ORGANIZATIONAL BLUEPRINT
The blueprint matrix view gives an overview of all applications used in an organizational unit, or used in support of certain processes. The matrix also visualizes the life cycles state and investment strategies of applications at hand.